Maps: US Natural Disaster Risk, Population Density, and Nuclear Facilities
|
Below is a compilation of US maps indicating Natural Disaster Risks like Earthquakes, Floods, Tornadoes, and Hurricanes (individual and as overlays), along with US Population Density breakdowns by counties (from the 2020 Census) and an up-to-date map of currently operating Nuclear Plants. We hope this information will help you be more informed about high-risk areas as they relate to your particular location and future plans. Natural Disaster Risk Map 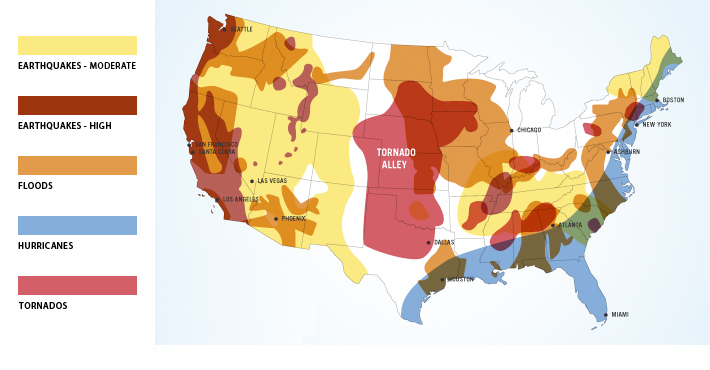 The map above overlays earthquakes (both moderate and high risk), floods, tornados, and hurricane risks in the continental United States. Data for this map was provided by Redcross.org and Noaa.gov. Earthquake Risk Map 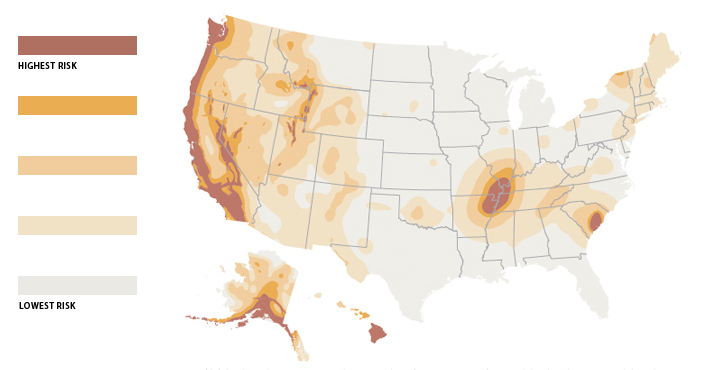 This map highlights Earthquake risk in the entire USA, based on US Geological Survey data. Tornado Risk Map 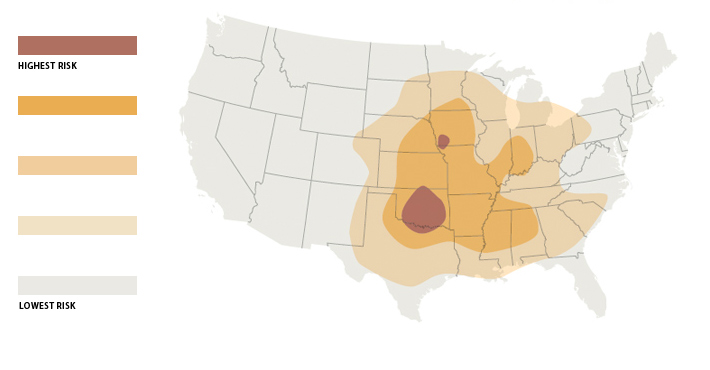 The map above displays Tornado risk in the United States, based on data provided by National Oceanic and Atmospheric Administration. Hurricane Risk Map 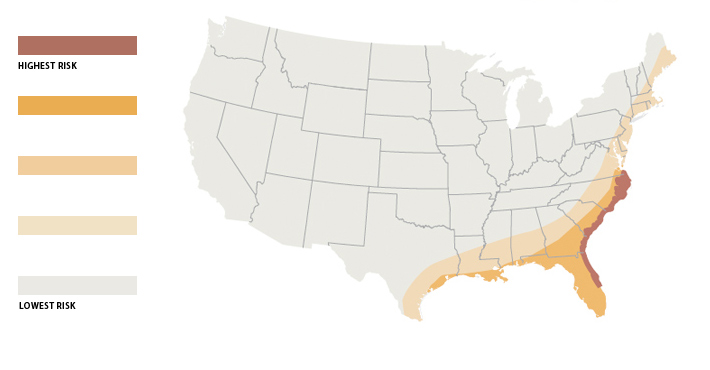 The map displayed above highlights the Hurricane risk in the continental US based on data provided by the University of Miami. US Population Density Map by Counties 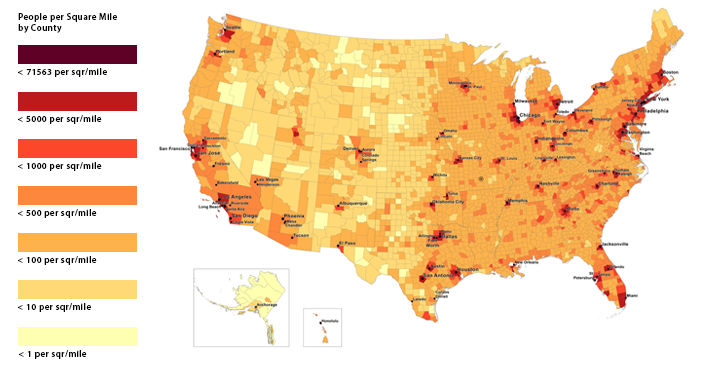 Above is US Population Density By County Map (2020 Census) provided by U.S. Census Bureau. Click on the map for an interactive map that you can use to zoom in for better detail. Nuclear Facilities and Seismic Hazards Map This map overlays Nuclear Facilities and Seismic Hazards. It shows areas of equal seismic hazard and indicates the minimum peak horizontal ground acceleration value, a measure of how hard the ground shakes in a given area. The map also shows the locations of the 65 US nuclear facilities. The data comes from the US Geological Survey Geological Hazards Team and the US Energy Information Administration. It was compiled by Mike Meuser from Mapcruzin.com. According to Mike as of March 2011, there are 65 operating nuclear power facilities in the U.S. Each facility has from 1 to 3 reactors for a total of 104. This number does NOT account for those reactors that are decommissioned, reactors at research and university facilities, or all of the nuclear waste at various locations around the United States. The catastrophe at the Fukushima plant in Japan should serve as a lesson to the United States as well as Japan. The map below illustrates just how vulnerable we could be: many of the United States’ nuclear facilities are located near areas of seismic activity. For a more detailed view, click here for a more high-resolution map. |